Difference between revisions of "Thin Layer Chromatography"
(TLC experiments) |
|||
| Line 33: | Line 33: | ||
* Because the spot was small, uv lighting safe but unsophisticated, and a phone was used for photography, the images have been highly processed to accentuate the spot | * Because the spot was small, uv lighting safe but unsophisticated, and a phone was used for photography, the images have been highly processed to accentuate the spot | ||
| − | + | === Solvent system comparison === | |
* The ethyl acetate system failed to move the spot at all for the salt preparation, and only slightly for the freebase version (possibly due to the DCM in the sample prep?). Only the failed freebase version is shown. | * The ethyl acetate system failed to move the spot at all for the salt preparation, and only slightly for the freebase version (possibly due to the DCM in the sample prep?). Only the failed freebase version is shown. | ||
| Line 39: | Line 39: | ||
* Only one spot was observed | * Only one spot was observed | ||
| − | + | <gallery> | |
| − | + | FreebaseEthlyMethWaterAmmProcessed.png|TLC: Freebase mehdma (dissolved in DCM) sample, with system of ethyl acetate : Methanol : Water : Ammonia as 95 : 3.5 : 1.5 : 0.75 | |
| − | + | 001SaltDCMMethAmmProc.png|TLC: Salt mehdma (dissolved in IPA and ammonia) sample, with system of DCM : Methanol : Ammonia as 90 : 9 : 1 | |
| + | File:FreebaseDCMMethAmmProcessedCurved.png|TLC: Freebase mehdma (dissolved in DCM) sample, with system of DCM : Methanol : Ammonia as 90 : 9 : 1 | ||
| + | </gallery> | ||
| + | |||
| + | === Reagent tests === | ||
| + | |||
| + | Here are the results of marquis, froedhe and ehrlich reagents applied for visualisation. The photos have been processed so that the spot appeared as observed. Due to the camera used, and the automatic processing, this means the following images are inconsistent but the spots are reasonably close to the colours observered. | ||
| + | |||
| + | * Freebase sample was used | ||
| + | * Plates were pre-washed with methanol, which reduced the presence of material on the solvent front | ||
| + | * No additional spots were found | ||
| + | * Ehrlich never revealed a spot | ||
| + | * Reference marquis and froedhe spots (on the plate but not put through TLC) were observed to be black | ||
| + | * After TLC, the marquis and froedhe spots were more vivid than applying the reagents to the raw sample, or to the plated reference | ||
| + | * Marquis had a vibrant blue to light blue fringe | ||
| + | * Froedhe had a vibrant purple fringe, later becoming slightly redder | ||
| + | |||
| + | <gallery> | ||
| + | 003NonTLCRefEarlyProc.png|Reference marquis, froedhe and ehrlich on plate without TLC | ||
| + | 003MarquisEarlyProc.png|Marquis visualisation of TLC plate, photographed soon after application. Blue to light blue fringing of dark spot | ||
| + | 003MarquisLaterProc.png|Marquis visualisation of TLC plate, photographed after a couple of minutes after application. Blue to light blue fringing of dark spot | ||
| + | 003FroehdeEarlyProc.png|Froedhe visualisation of TLC plate, photographed soon after application. Purple fringing of dark spot | ||
| + | 003FroehdeLaterProc.png|Froedhe visualisation of TLC plate, photographed soon after application. Slightly redder purple fringing of dark spot | ||
| + | 003EhrlichEarlyProc.png|Ehrlich visualisation of TLC plate, photographed soon after application. No reaction | ||
| + | </gallery> | ||
== To do == | == To do == | ||
| − | * | + | * Other reagent and other visualisation methods applied to plates. |
* Different systems | * Different systems | ||
Revision as of 11:28, 17 May 2020
Contents
TLC Intro
Here you will find some experiments in thin layer chromatography of mehdma samples. The information should be relevant to magic samples as well, and also to other forms of chromatography.
Please note that the content here, at the time of writing, is by a beginner in TLC so do not expect it to be definitive.
Preparation
Two preparations have been tested:
- Salt version: salt dissolved in isopropanol 10mg per ml, plus a small amount of ammonia (possibly not necessary). Takes a long time to dissolve
- Freebased mehdma, dissolved in DCM, 10mg per ml (minus losses in freebasing procedure)
TLC systems
- System 1: ethyl acetate : Methanol : Water : Ammonia as 95 : 3.5 : 1.5 : 0.75
- System 2: DCM : Methanol : Ammonia as 90 : 9 : 1
Plates
Silica 254 UV Loaded with pulled capillary for a small spot
Visualisation
254nm UV
Results
Please note the following quality issues:
- The plates were not pre-washed and show considerable material on the solvent front. This was also present with a plate with no sample.
- Because the spot was small, uv lighting safe but unsophisticated, and a phone was used for photography, the images have been highly processed to accentuate the spot
Solvent system comparison
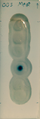
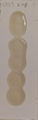
- The ethyl acetate system failed to move the spot at all for the salt preparation, and only slightly for the freebase version (possibly due to the DCM in the sample prep?). Only the failed freebase version is shown.
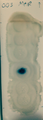
- Both the salt and freebase moved well with the DCM based system
- Only one spot was observed
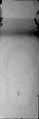
TLC: Freebase mehdma (dissolved in DCM) sample, with system of ethyl acetate : Methanol : Water : Ammonia as 95 : 3.5 : 1.5 : 0.75
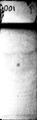
TLC: Salt mehdma (dissolved in IPA and ammonia) sample, with system of DCM : Methanol : Ammonia as 90 : 9 : 1
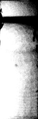
TLC: Freebase mehdma (dissolved in DCM) sample, with system of DCM : Methanol : Ammonia as 90 : 9 : 1
Reagent tests
Here are the results of marquis, froedhe and ehrlich reagents applied for visualisation. The photos have been processed so that the spot appeared as observed. Due to the camera used, and the automatic processing, this means the following images are inconsistent but the spots are reasonably close to the colours observered.
- Freebase sample was used
- Plates were pre-washed with methanol, which reduced the presence of material on the solvent front
- No additional spots were found
- Ehrlich never revealed a spot
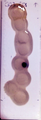
- Reference marquis and froedhe spots (on the plate but not put through TLC) were observed to be black
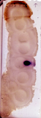
- After TLC, the marquis and froedhe spots were more vivid than applying the reagents to the raw sample, or to the plated reference
- Marquis had a vibrant blue to light blue fringe
- Froedhe had a vibrant purple fringe, later becoming slightly redder
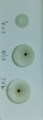
Reference marquis, froedhe and ehrlich on plate without TLC
Marquis visualisation of TLC plate, photographed soon after application. Blue to light blue fringing of dark spot
Marquis visualisation of TLC plate, photographed after a couple of minutes after application. Blue to light blue fringing of dark spot
Froedhe visualisation of TLC plate, photographed soon after application. Purple fringing of dark spot
Froedhe visualisation of TLC plate, photographed soon after application. Slightly redder purple fringing of dark spot
Ehrlich visualisation of TLC plate, photographed soon after application. No reaction
To do
- Other reagent and other visualisation methods applied to plates.
- Different systems